Section 10 - Manage security operations - Configure and manage threat protection
Simulating alerts
You can simulate alerts by downloading one of the following playbooks:
- For Windows: Microsoft Defender for Cloud Playbook: Security Alerts
- For Linux: Microsoft Defender for Cloud Playbook: Linux Detections.
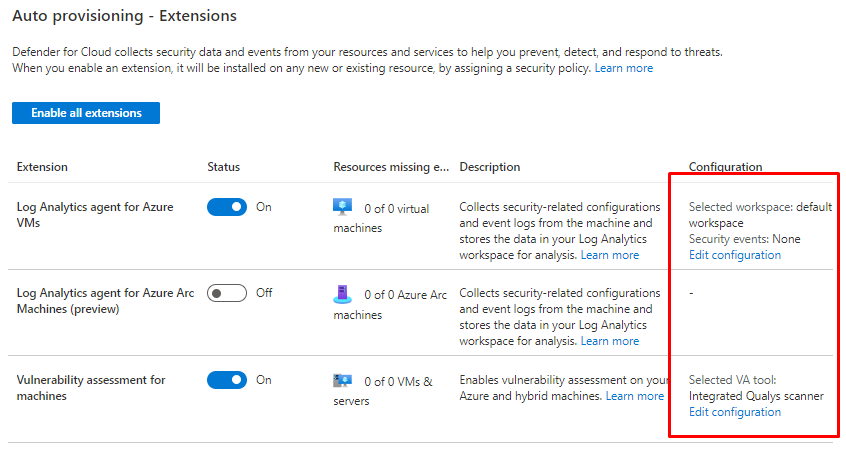
Enabling Defender for Servers
From Auto provisioning menu you can enable extensions
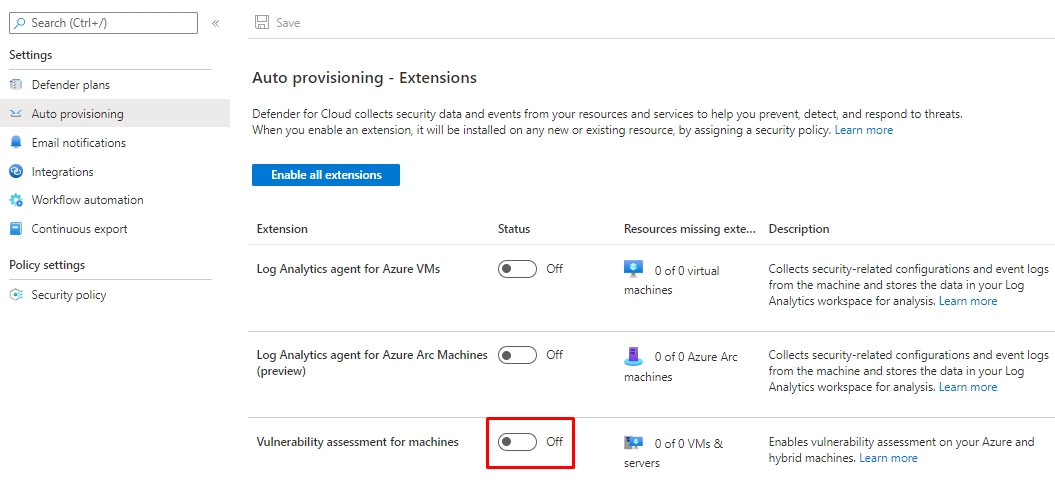
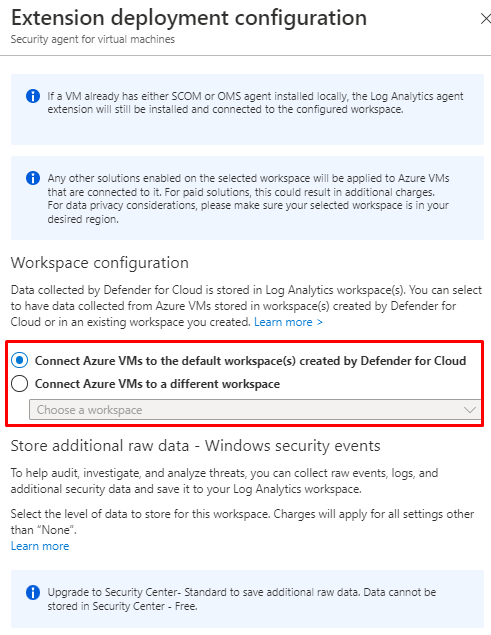
For Log analytics you can define to provision a new Workspace or use an existing one.
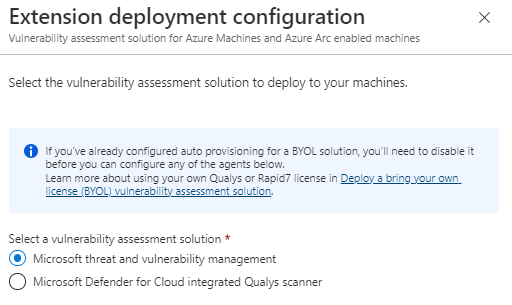
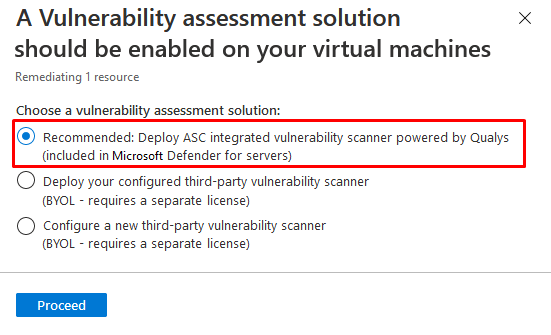
And from Vulnerability assessment solution for Azure Machines you can choose either Microsoft or Qualys scanners
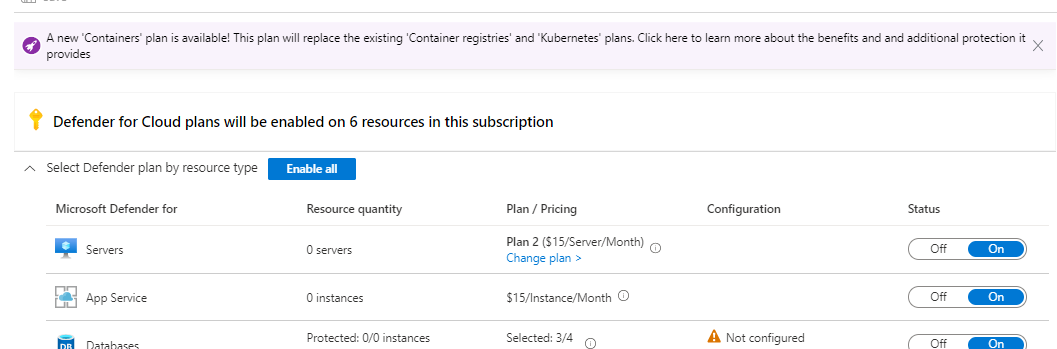
And then you can see the options under main page
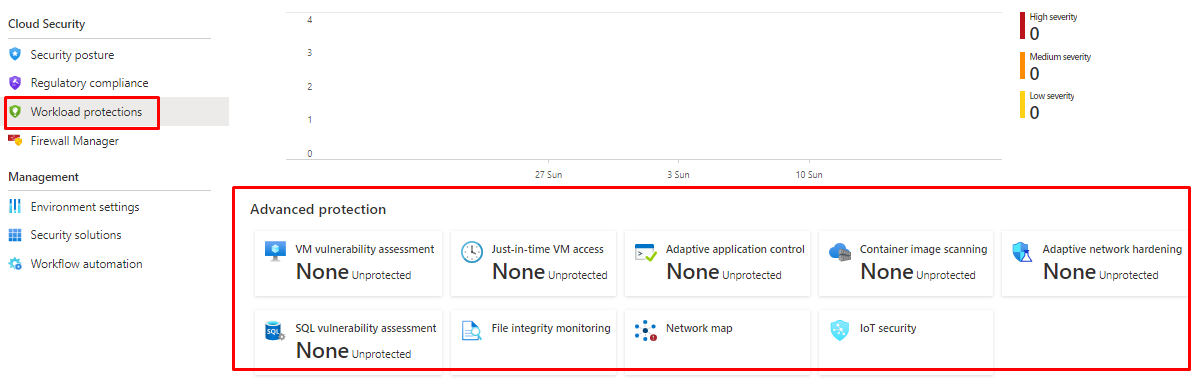
From Workload protections page you can all the other options for protection
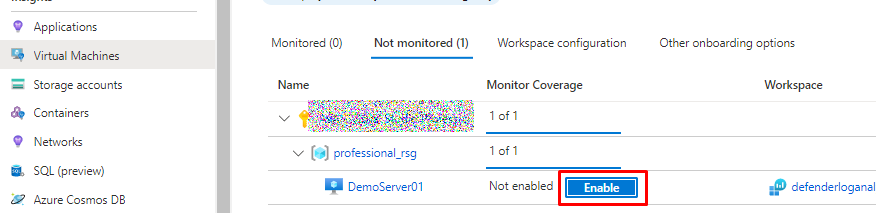
Azure servers
Azure servers will be seen under Log analytics but not connected
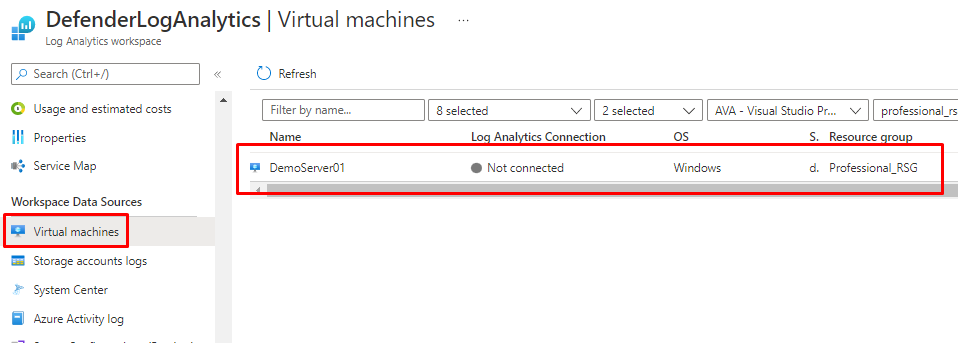
You will connect it from here
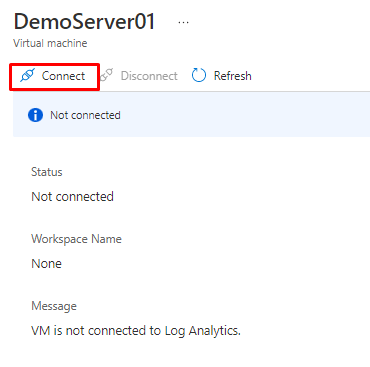
or from the VM monitoring and Logs
Either way the aftermath is the same.
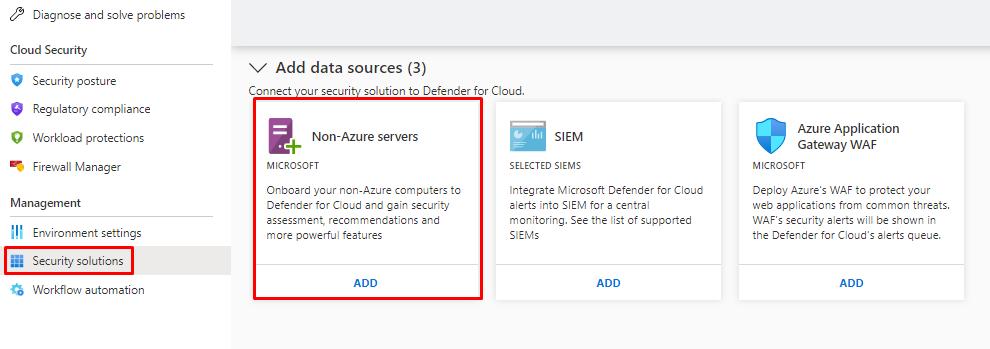
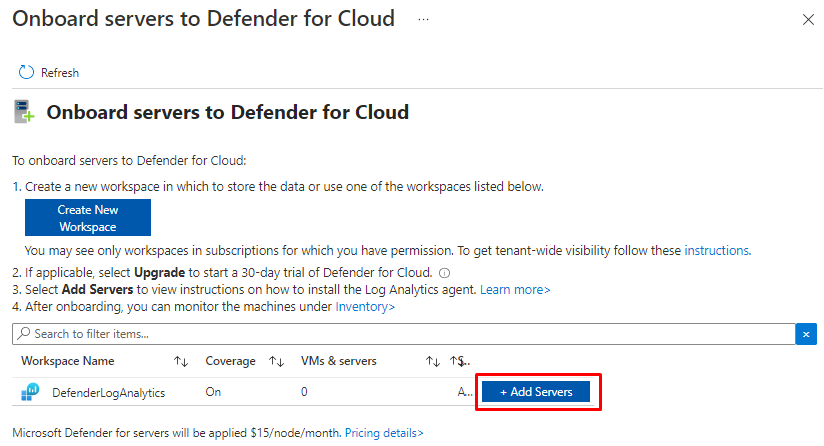
Non-Azure servers
You can onboard non-Azure servers also, you have install Log analytics agent (Microsoft Monitoring Agent)
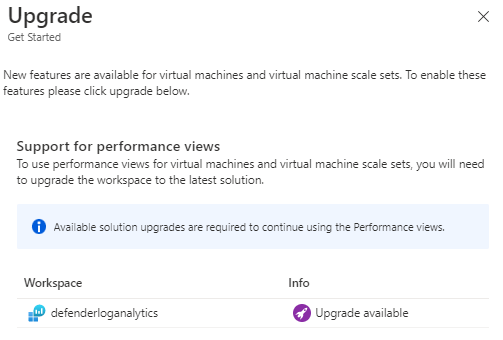
If not already done, you need to upgrade your Log analytics to use with Defender
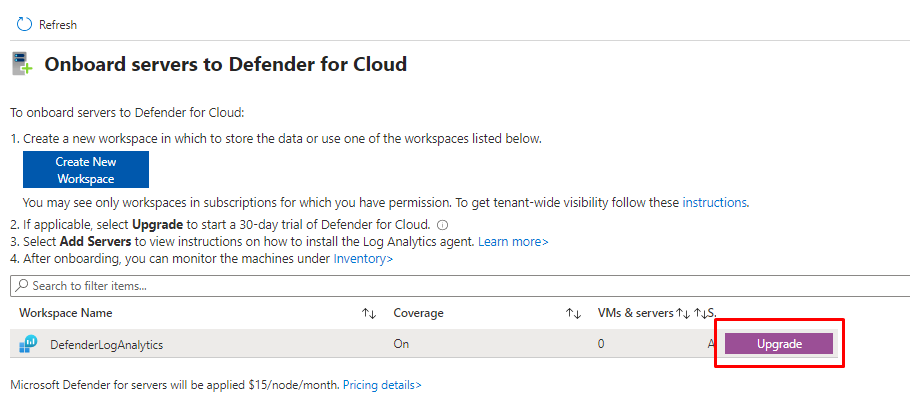
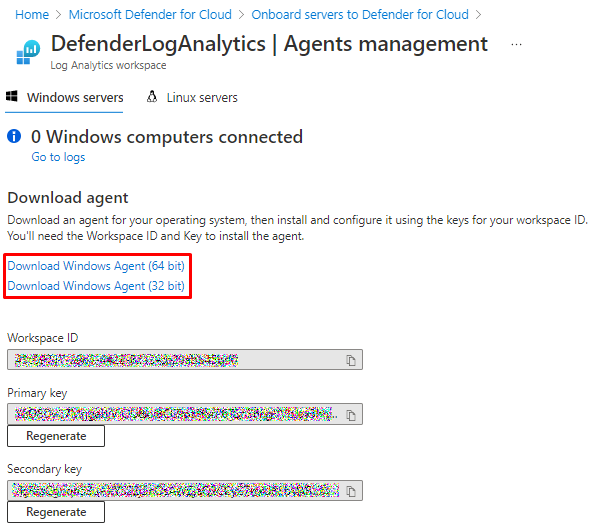
Next you need an Log analytics workspace and then choose Add servers
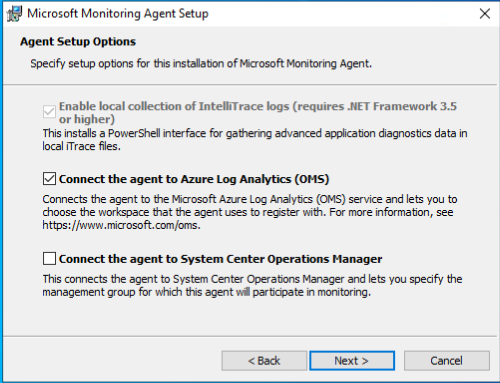
Download correct agent and install with they ID and keys provided.
And install (You also connect so SCOM with this agent)
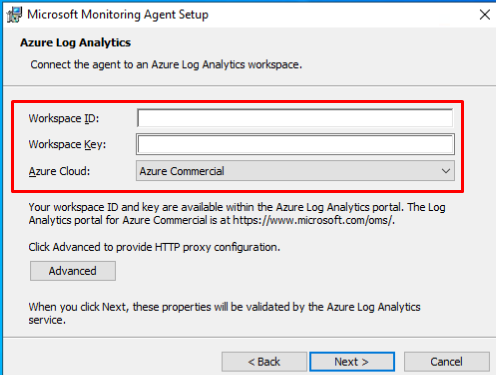
And enter the info
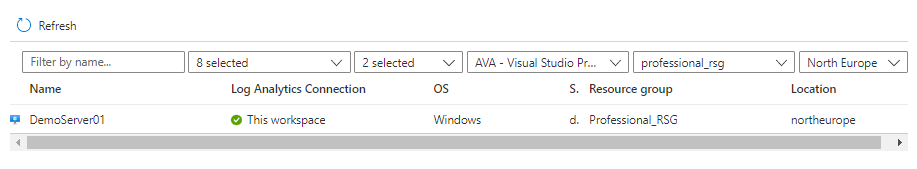
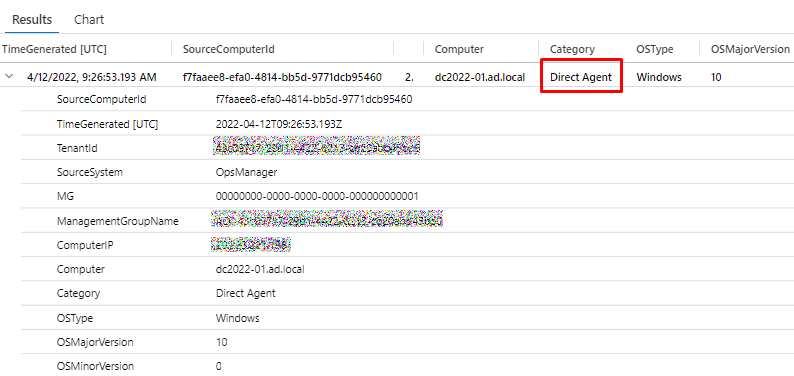
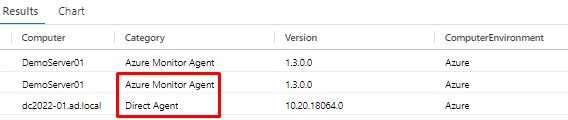
Once agent connects to Log analytics, you can find the computer with the following
Heartbeat | where OSType == 'Windows' | summarize arg_max(TimeGenerated, *) by SourceComputerId | sort by Computer | render table
And it will display the computer and notice that it will be shown as Direct agent connection
Should I switch to the Azure Monitor agent?
To start transitioning your VMs off the current agents to the new agent, consider the following factors:
- Environment requirements: The Azure Monitor agent supports these operating systems today. Support for future operating system versions, environment support, and networking requirements will only be provided in this new agent. If the Azure Monitor agent supports your current environment, start transitioning to it.
- Current and new feature requirements: The Azure Monitor agent introduces several new capabilities, such as filtering, scoping, and multi-homing. But it isn't at parity yet with the current agents for other functionality. View current limitations and supported solutions.That said, most new capabilities in Azure Monitor will be made available only with the Azure Monitor agent. Review whether the Azure Monitor agent has the features you require and if there are some features that you can temporarily do without to get other important features in the new agent.If the Azure Monitor agent has all the core capabilities you require, start transitioning to it. If there are critical features that you require, continue with the current agent until the Azure Monitor agent reaches parity.
- Tolerance for rework: If you're setting up a new environment with resources such as deployment scripts and onboarding templates, assess the effort involved. If the setup will take a significant amount of work, consider setting up your new environment with the new agent as it's now generally available.
Coexistence with other agents
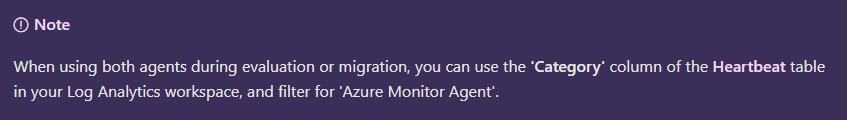
The Azure Monitor agent can coexist (run side by side on the same machine) with the legacy Log Analytics agents so that you can continue to use their existing functionality during evaluation or migration. While this allows you to begin transition given the limitations, you must review the below points carefully:
- Be careful in collecting duplicate data because it could skew query results and affect downstream features like alerts, dashboards or workbooks. For example, VM insights uses the Log Analytics agent to send performance data to a Log Analytics workspace. You might also have configured the workspace to collect Windows events and Syslog events from agents. If you install the Azure Monitor agent and create a data collection rule for these same events and performance data, it will result in duplicate data. As such, ensure you're not collecting the same data from both agents. If you are, ensure they're collecting from different machines or going to separate destinations.
- Besides data duplication, this would also generate more charges for data ingestion and retention.
- Running two telemetry agents on the same machine would result in double the resource consumption, including but not limited to CPU, memory, storage space and network bandwidth.
Azure Monitor's Log Analytics agent is retiring on 31 August 2024. The current agents will be supported until the retirement date.
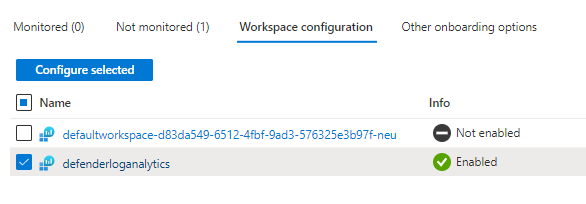
Adding existing Log analytics to Monitor
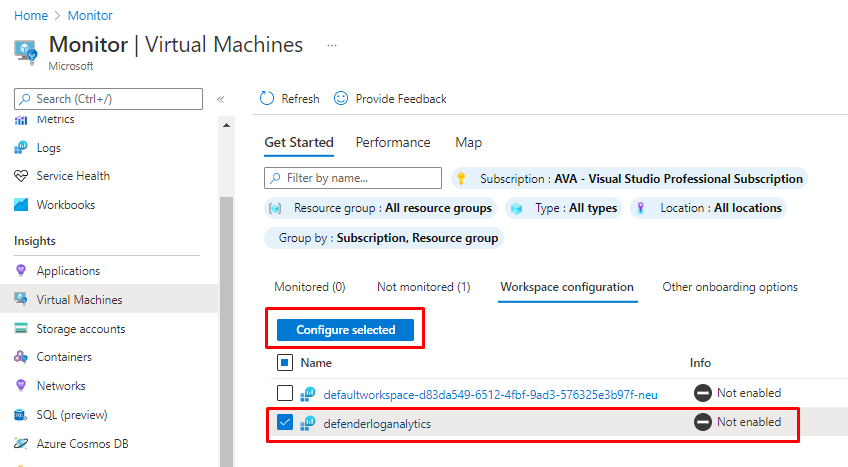
And enabled
Enabling the VM
And the Log analytics instance
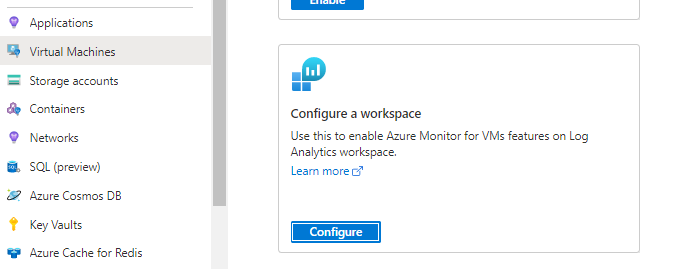
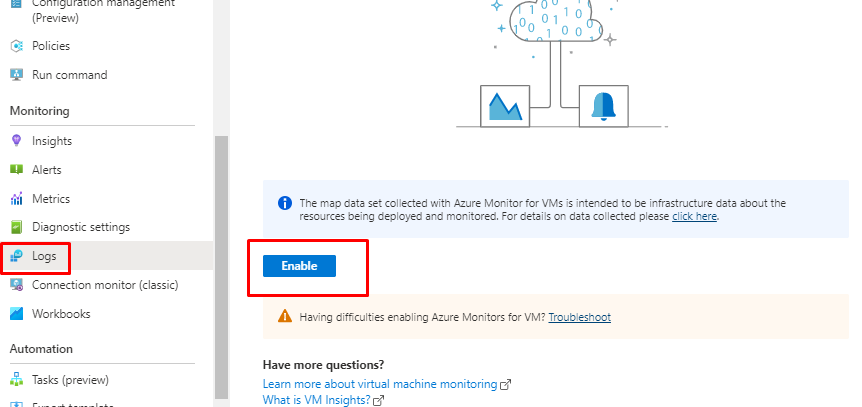
Enabling Azure Monitor for VMs on your log analytics workspace will install VM Insights solution that collects performance counters and metrics from all the virtual machines connected to the workspace.
And finally you will see your VM's inside Monitor
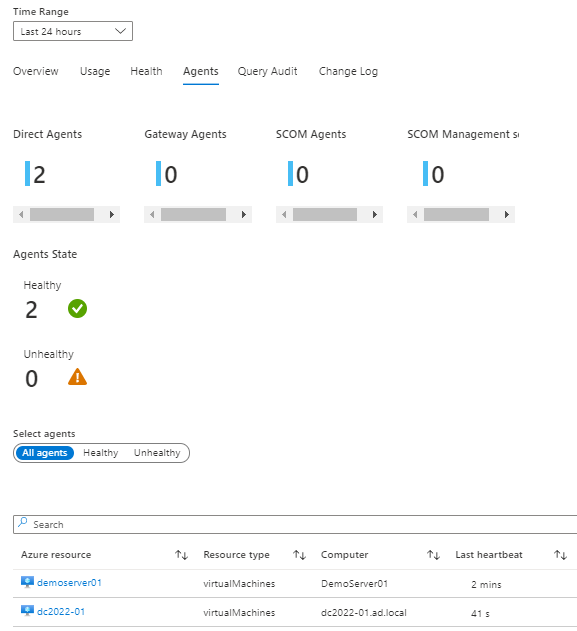
KQL query for Virtual machines inside Monitor
You can use the following query to see VM stats
let RelevantResources= Heartbeat | where TimeGenerated > ago(1d) | summarize TimeSinceLastHeartbeatSeconds=(now() - max(TimeGenerated)) / 1s by _ResourceId | extend AgentState = iff(TimeSinceLastHeartbeatSeconds < 300, "Healthy", "Unhealthy") // Computers that sent heartbeats over 5 minutes ago | where AgentState == 'All agents' or 'All agents' == "All agents" | project _ResourceId; let Trend= Heartbeat | where TimeGenerated > ago(1d) | where _ResourceId in (RelevantResources) | make-series HeartbeatsTrend=count() on TimeGenerated from (ago(1d)) to (now()) step (30m) by _ResourceId ; Heartbeat | where TimeGenerated > ago(1d) | where _ResourceId in (RelevantResources) | summarize TimeSinceLastHeartbeatSeconds=(now() - max(TimeGenerated)) / 1s by _ResourceId, ResourceType, Computer, OSType, OSName, Version, SubscriptionId, ResourceGroup, Category, ComputerEnvironment | join kind=inner (Trend) on _ResourceId | extend OS = strcat(OSType, iff(OSName == "", "", strcat(" (", OSName, ")"))) | project _ResourceId, ResourceType, Computer, TimeSinceLastHeartbeatSeconds, HeartbeatsTrend, OS, Category, Version, ComputerEnvironment, SubscriptionId, ResourceGroup | sort by TimeSinceLastHeartbeatSeconds descAnd it will show you two different agents, Direct is for Log analytics and Azure Monitor is for Monitor.
If you have on-premises servers, you will see them as hybrids (all of mine are inside Azure for demonstrative purposes)
How to add non-Azure servers
Enable Azure Monitor for a hybrid environment - Azure Monitor
Evaluate vulnerability scans from Azure Defender
Availability
| Aspect | Details |
|---|---|
| Release state: | General availability (GA) |
| Machine types (hybrid scenarios): | |
| Pricing: | Requires Microsoft Defender for Servers Plan 2 |
| Required roles and permissions: | Owner (resource group level) can deploy the scanner Security Reader can view findings |
| Clouds: |
How the integrated vulnerability scanner works
The vulnerability scanner extension works as follows:
- Deploy - Microsoft Defender for Cloud monitors your machines and provides recommendations to deploy the Qualys extension on your selected machine/s.
- Gather information - The extension collects artifacts and sends them for analysis in the Qualys cloud service in the defined region.
- Analyze - Qualys' cloud service conducts the vulnerability assessment and sends its findings to Defender for Cloud.
Enable default policy
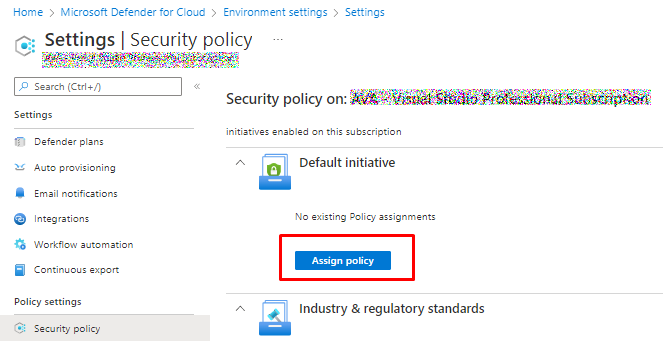
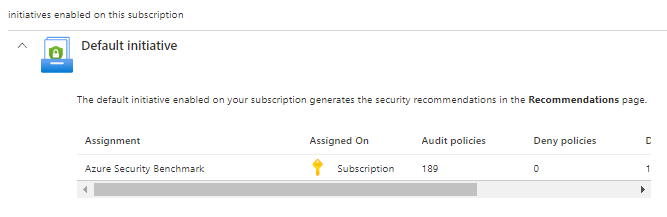
And it will open Azure Security Benchmark for you to assign
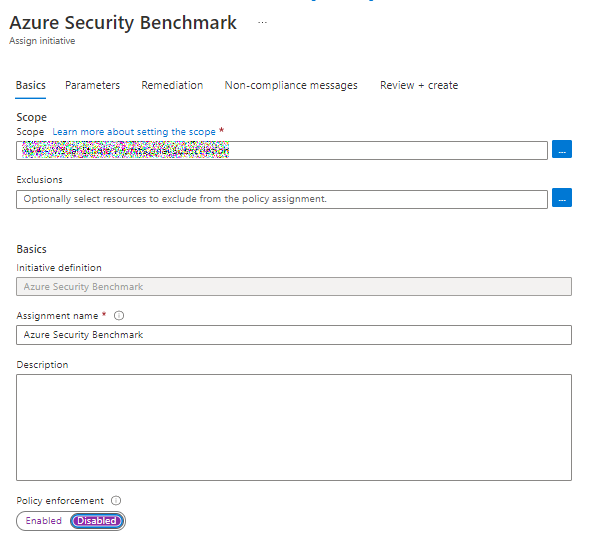
And on the next page we will see the effects is has, remember the effects from the last section?
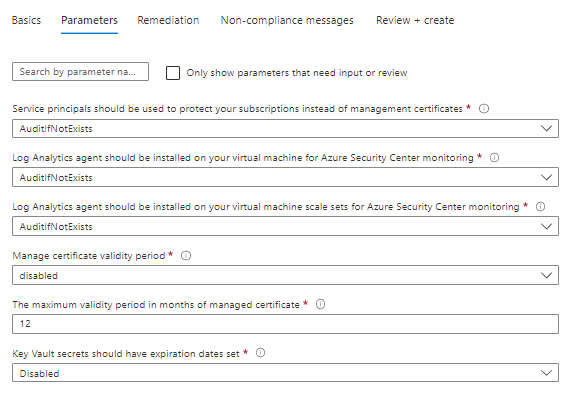
Once enabled, you will see 189 policies from Security benchmark
And after a while you will see Machines should have a vulnerability assessment solution under recommendations.
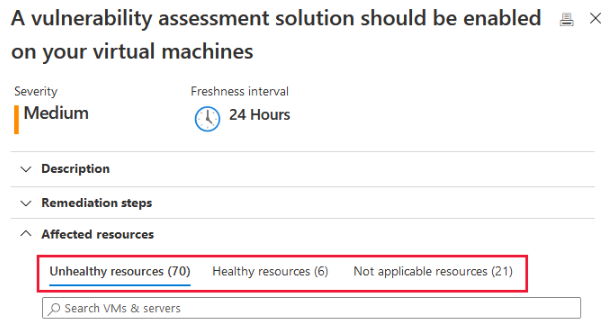
and you can deploy assessment with ASC enforced policy
Scanning frequency
Scanning begins automatically as soon as the extension is successfully deployed. Scans will then run every 12 hours. This interval isn't configurable.
Trigger an on-demand scan
You can trigger an on-demand scan from the machine itself, using locally or remotely executed scripts or Group Policy Object (GPO). Alternatively, you can integrate it into your software distribution tools at the end of a patch deployment job.
The following commands trigger an on-demand scan:
- Windows machines:
REG ADD HKLM\SOFTWARE\Qualys\QualysAgent\ScanOnDemand\Vulnerability /v "ScanOnDemand" /t REG_DWORD /d "1" /f - Linux machines:
sudo /usr/local/qualys/cloud-agent/bin/cloudagentctl.sh action=demand type=vm
Results
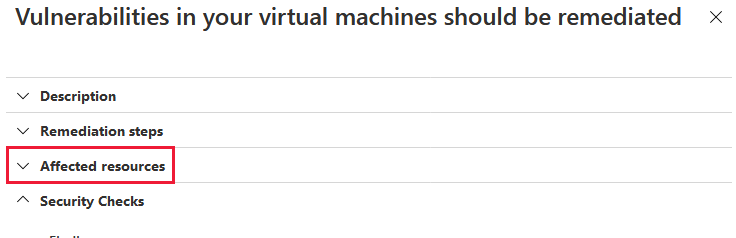
To view vulnerability assessment findings (from all of your configured scanners) and remediate identified vulnerabilities:
- From Defender for Cloud's menu, open the Recommendations page.
- Select the recommendation Machines should have vulnerability findings resolved.Defender for Cloud shows you all the findings for all VMs in the currently selected subscriptions. The findings are ordered by severity.
Disable specific findings
If you have an organizational need to ignore a finding, rather than remediate it, you can optionally disable it. Disabled findings don't impact your secure score or generate unwanted noise.
When a finding matches the criteria you've defined in your disable rules, it won't appear in the list of findings. Typical scenarios include:
- Disable findings with severity below medium
- Disable findings that are non-patchable
- Disable findings with CVSS score below 6.5
- Disable findings with specific text in the security check or category (for example, “RedHat”, “CentOS Security Update for sudo”)
Export the results
To export vulnerability assessment results, you'll need to use Azure Resource Graph (ARG). This tool provides instant access to resource information across your cloud environments with robust filtering, grouping, and sorting capabilities. It's a quick and efficient way to query information across Azure subscriptions programmatically or from within the Azure portal.
Things to remember
Different security solutions inside Defender for servers and licensing
How to provision extension with Defender
How to onboard non-Azure servers
For the future. migrating Log analytics agents to Azure monitor agents
Different vulnerability solutions

Default policy is Azure Security Benchmark and it has to be applied to the subscription
Scanning frequency and how to initiate manual scan