


You won't find Agent 365 in the Content Hub
Microsoft published a blog post in May 2026 about the "Agent 365 connector" for Microsoft Sentinel — a way to stream AI agent telemetry into the Sentinel data lake so SOC teams can monitor, hunt, and investigate agent behavior. Sounds useful. So I went into the Defender portal, opened the Content hub, and searched for Agent 365.
Nothing.
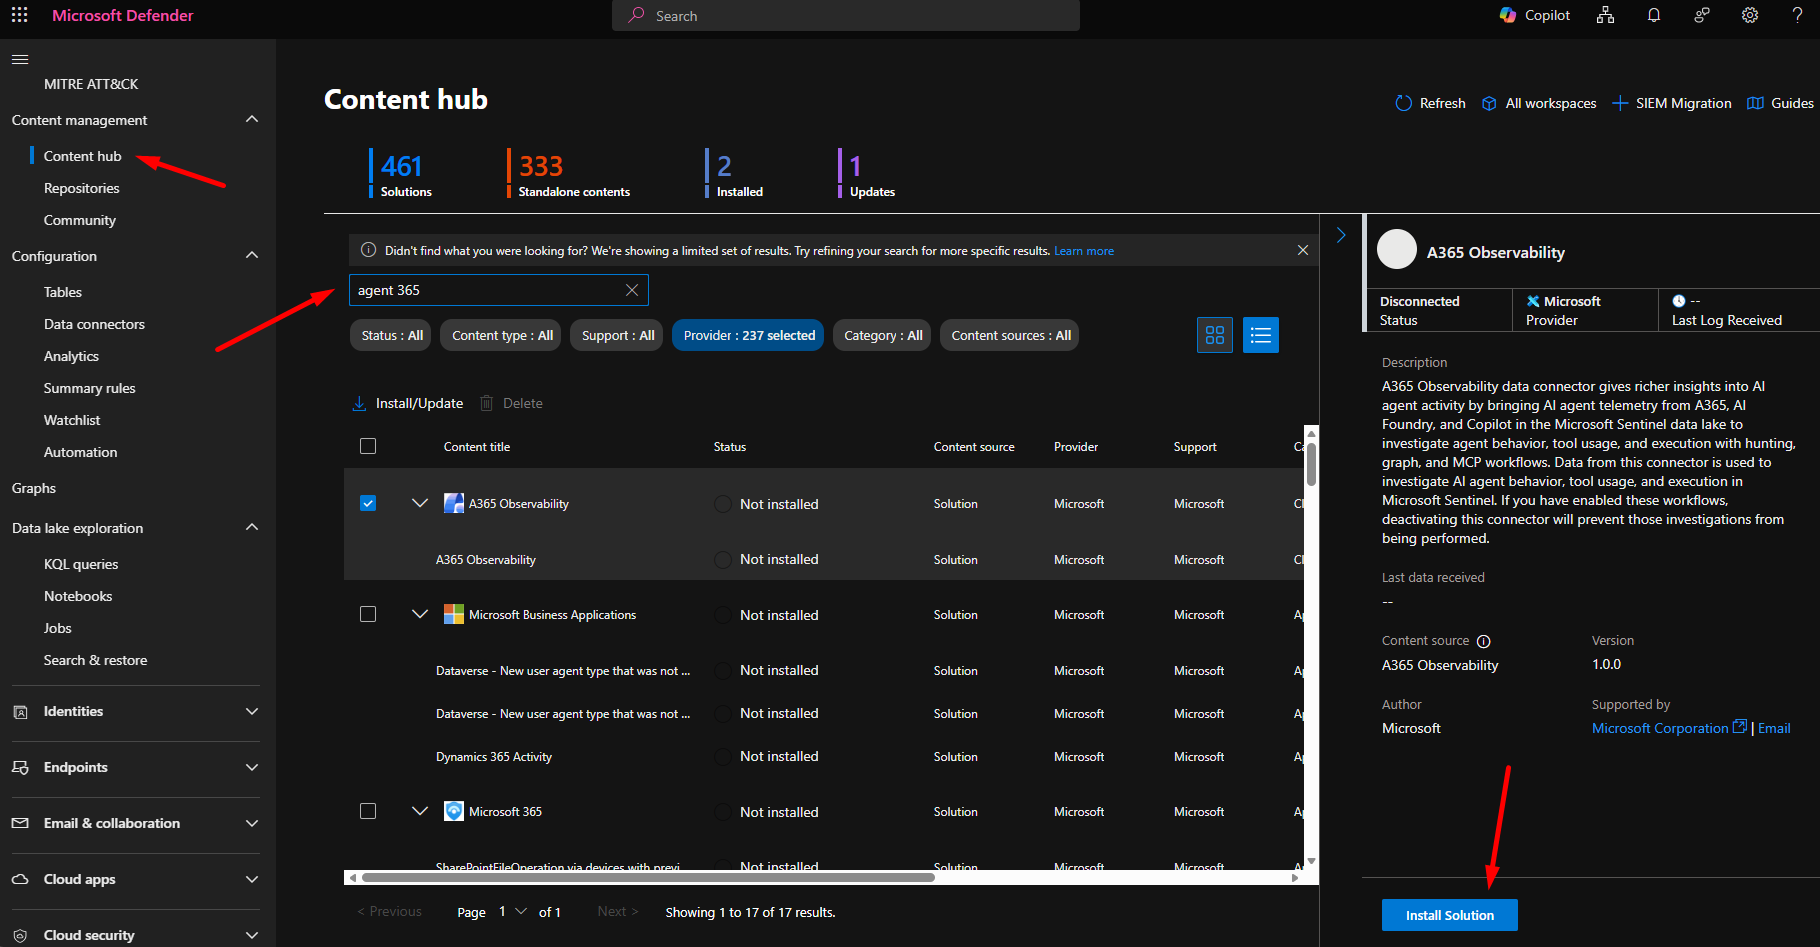
Well, not exactly nothing. The search returned 17 results, but none of them were called "Agent 365". The solution you're actually looking for is named A365 Observability. Not a suprise in hindsight — the connector is named after the observability capability, not the product it ingests data from. But if you're going in blind off the blog post title, you'll spend a few minutes wondering if it's rolled out to your tenant yet.
What A365 Observability actually does
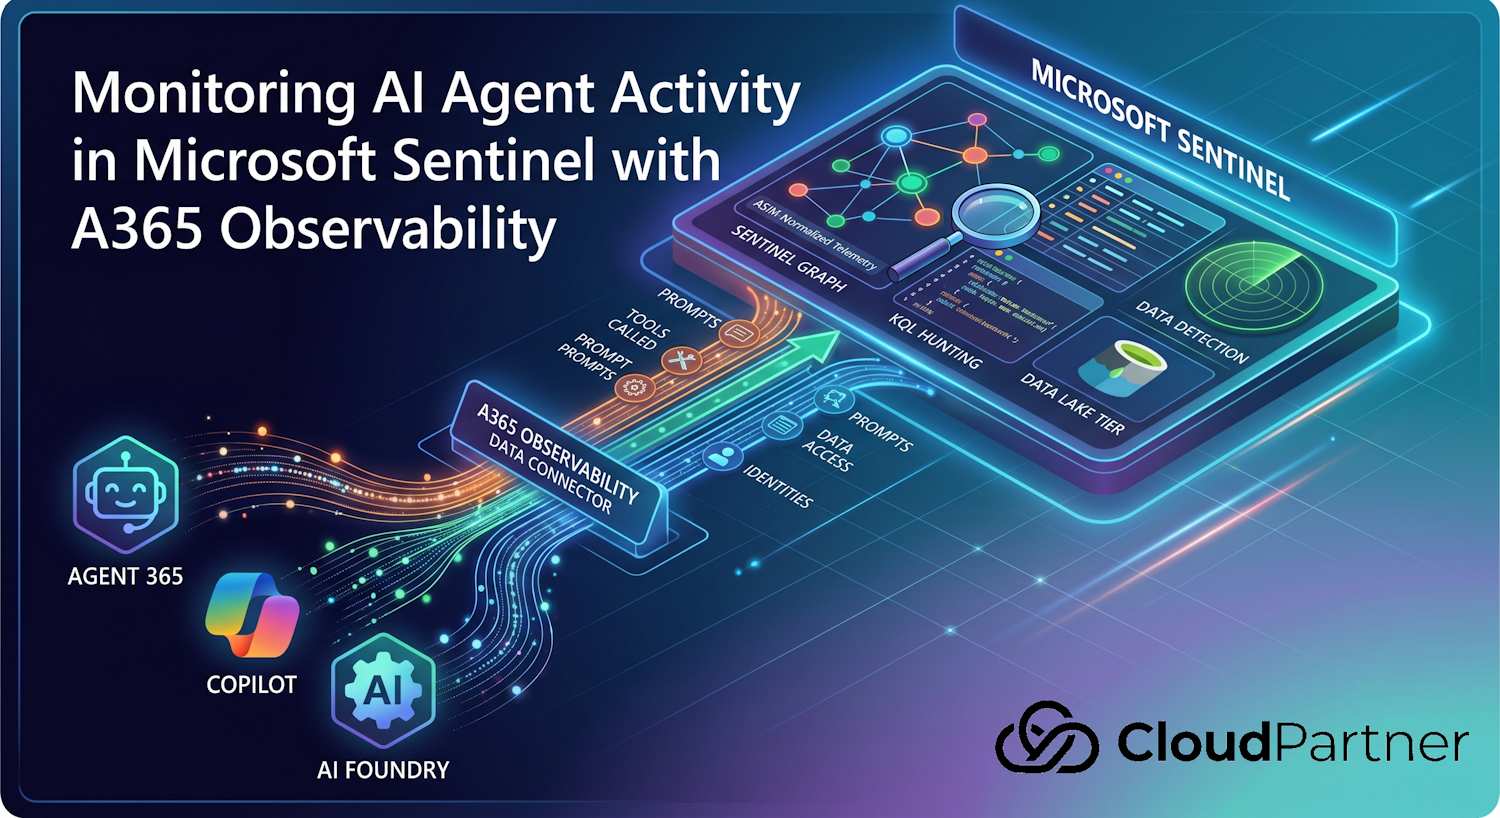
The A365 Observability data connector brings AI agent telemetry from Agent 365, AI Foundry, and Copilot into the Microsoft Sentinel data lake. Once connected, the data sits alongside your identity, endpoint, and cloud signals — queryable with KQL, navigable with the Sentinel graph, and reachable through MCP-powered investigation workflows.
The connector is currently in public preview (announced May 18, 2026). It's free, provided by Microsoft, and ships as a single data connector within the A365 Observability solution.
Under the hood, two things happen when you connect it:
- Unified agent telemetry ingestion — agent activity from Agent 365 streams into the Sentinel data lake. That includes what agents did, what tools they called, what data they accessed, and which identities they acted on behalf of.
- ASIM-normalized schema — the data lands in a schema aligned with ASIM (Advanced Security Information Model), so it's consistent and ready for analytics rules and detection engineering without custom transformation.
Installing A365 Observability
Go to the Microsoft Defender portal, navigate to Microsoft Sentinel, then open Content hub under Content management. Search for agent 365 — you'll find A365 Observability in the results. Select it, click Install Solution in the right panel, and it installs in a few seconds.
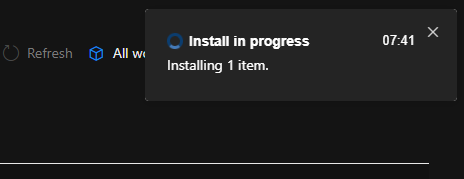
The installation is fast — you'll see an "Install in progress — Installing 1 item" notification in the top right, and it completes almost immediately.
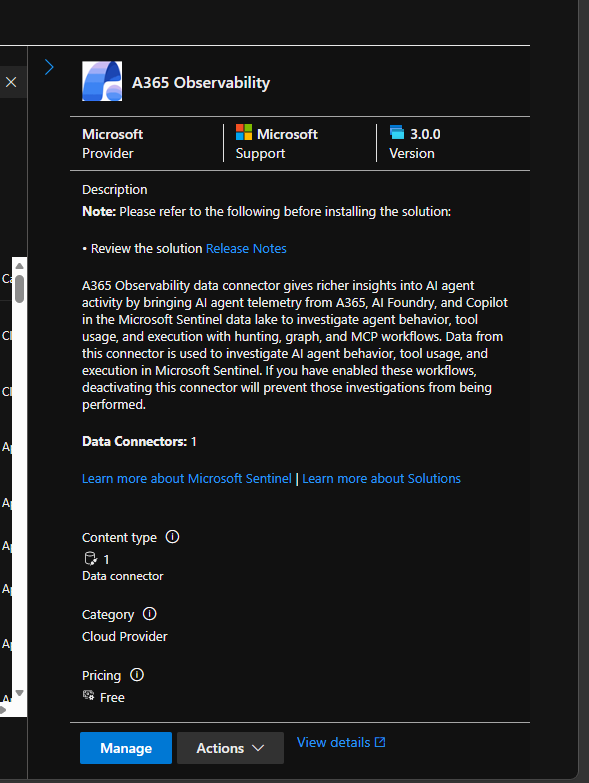
After it's installed, the solution page shows "1 Installed content item" and "1 Configuration needed" — that's your cue to open the connector page and actually connect it.
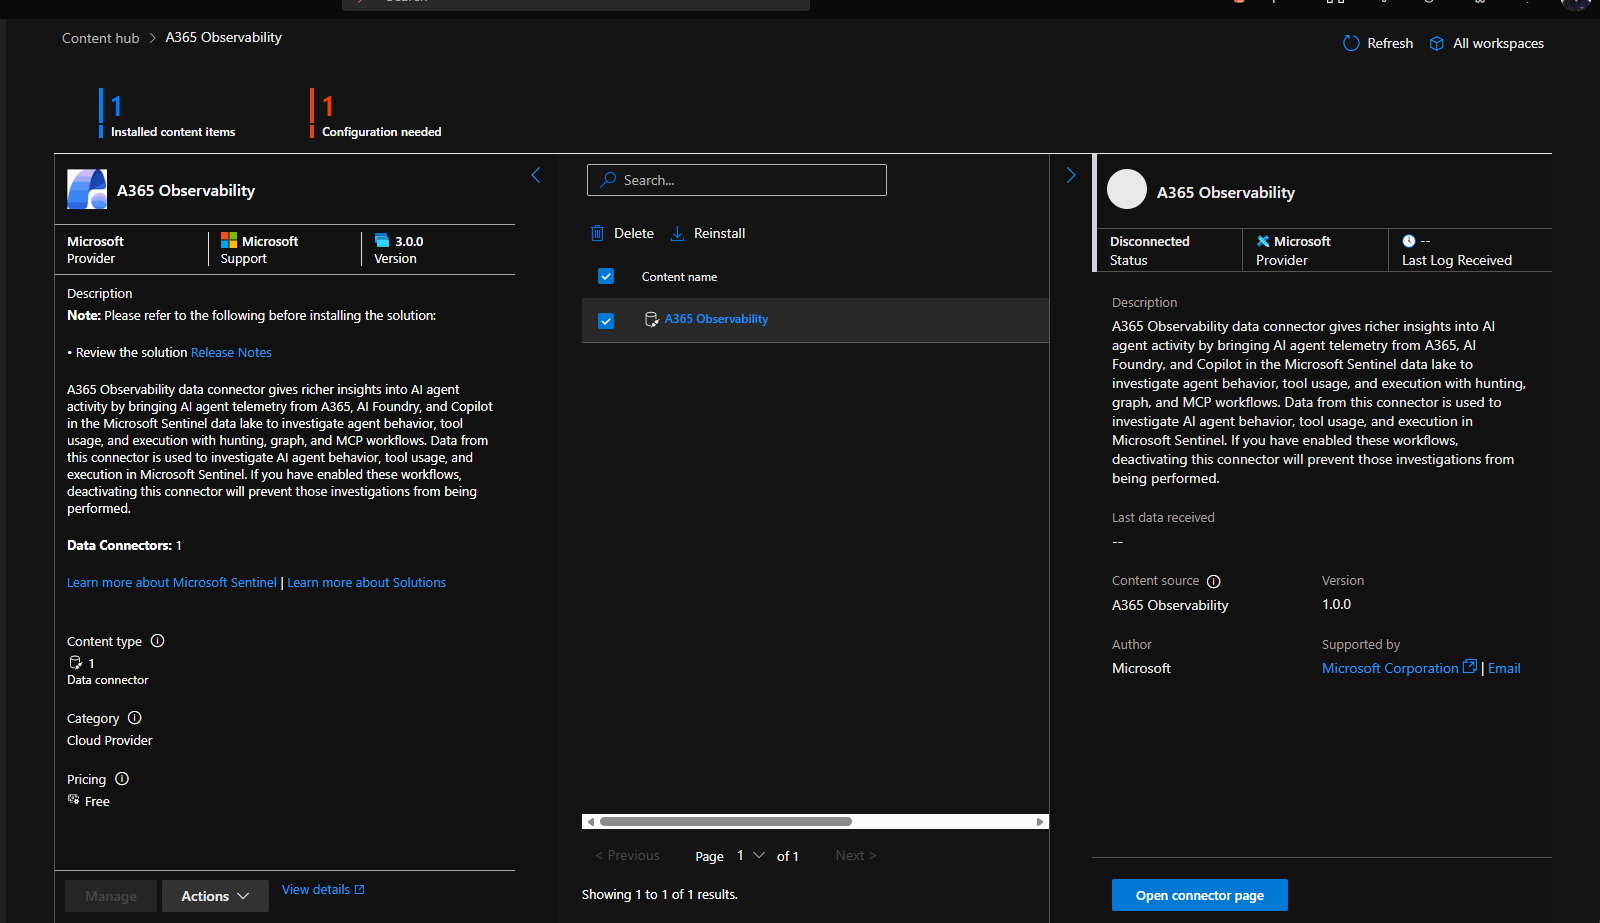
Note: You need Global Administrator permissions on the workspace's tenant to connect this data connector. Contributor alone isn't enough.
Connecting the connector
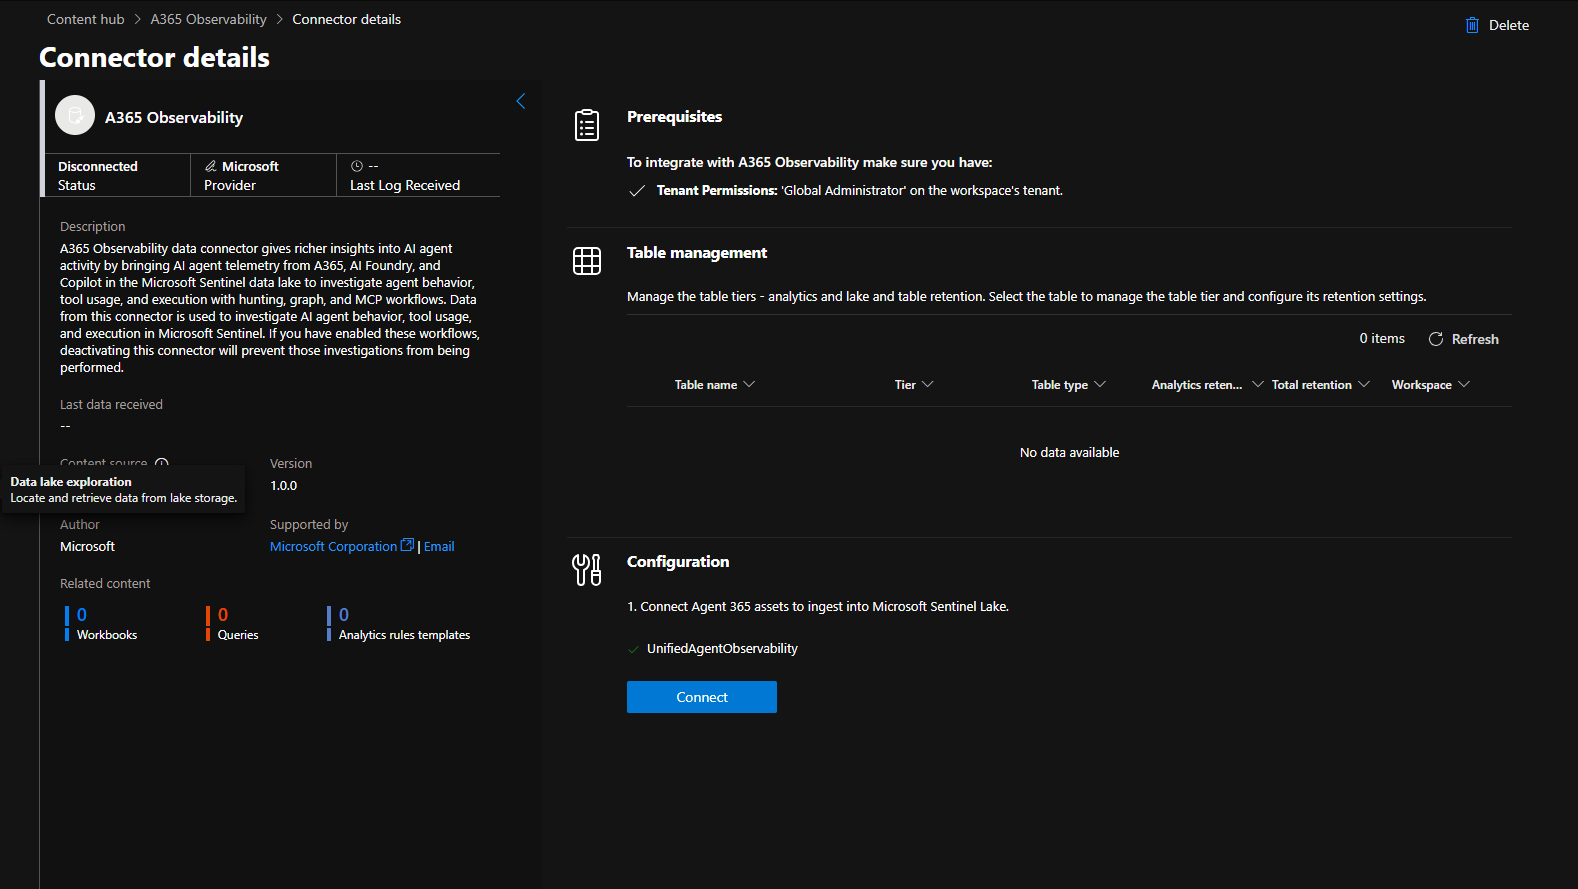
After installation, click Open connector page from the solution view. The connector details page shows the prerequisites, a table management section (empty until you connect), and a configuration section with a single step: connect Agent 365 assets to ingest into Microsoft Sentinel Lake.
There's one checkbox — UnifiedAgentObservability — and a Connect button. Tick it and click Connect.
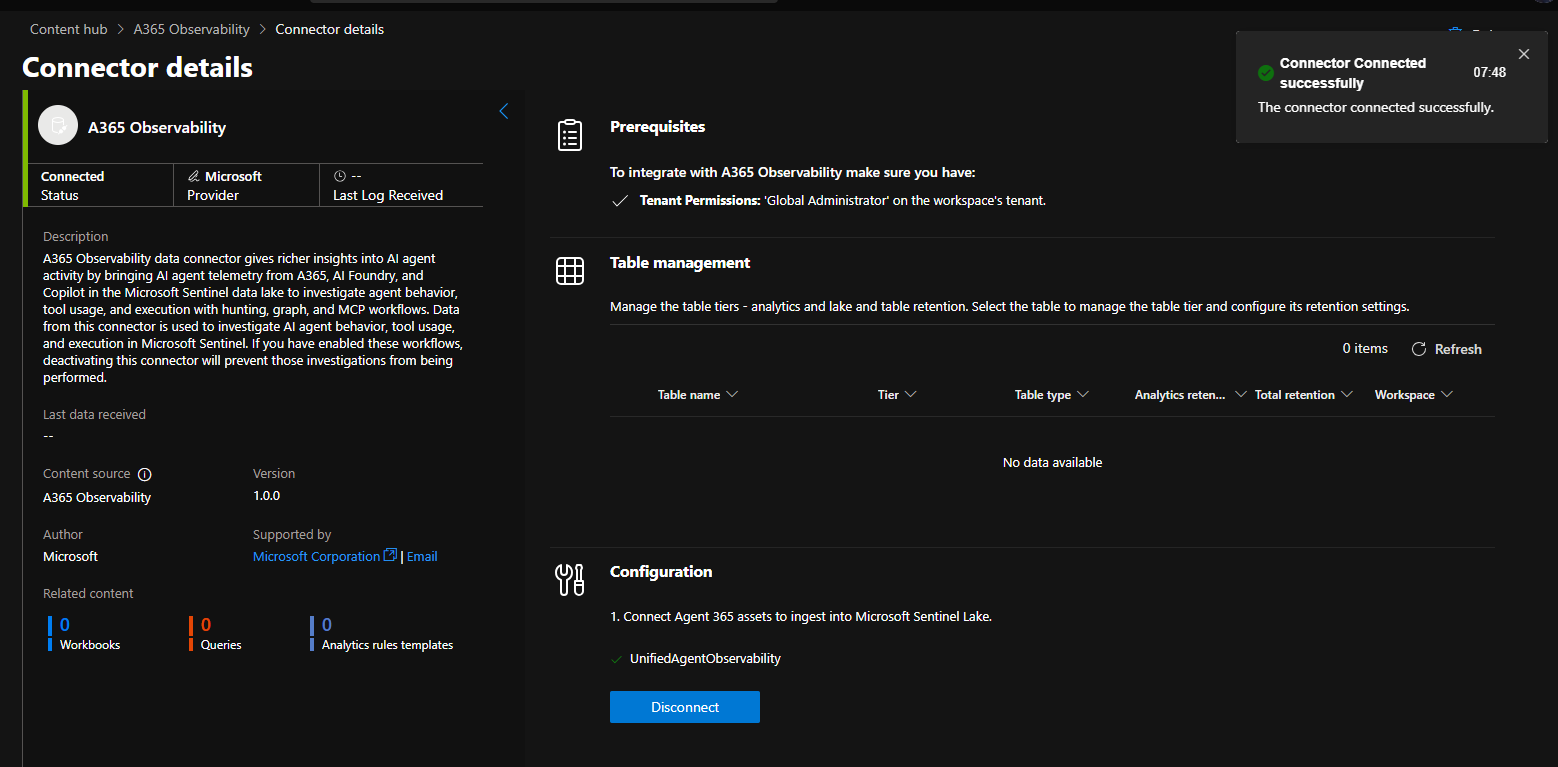
Connection completes quickly. You'll get a "Connector Connected successfully" toast in the top right, and the connector status changes to Connected.
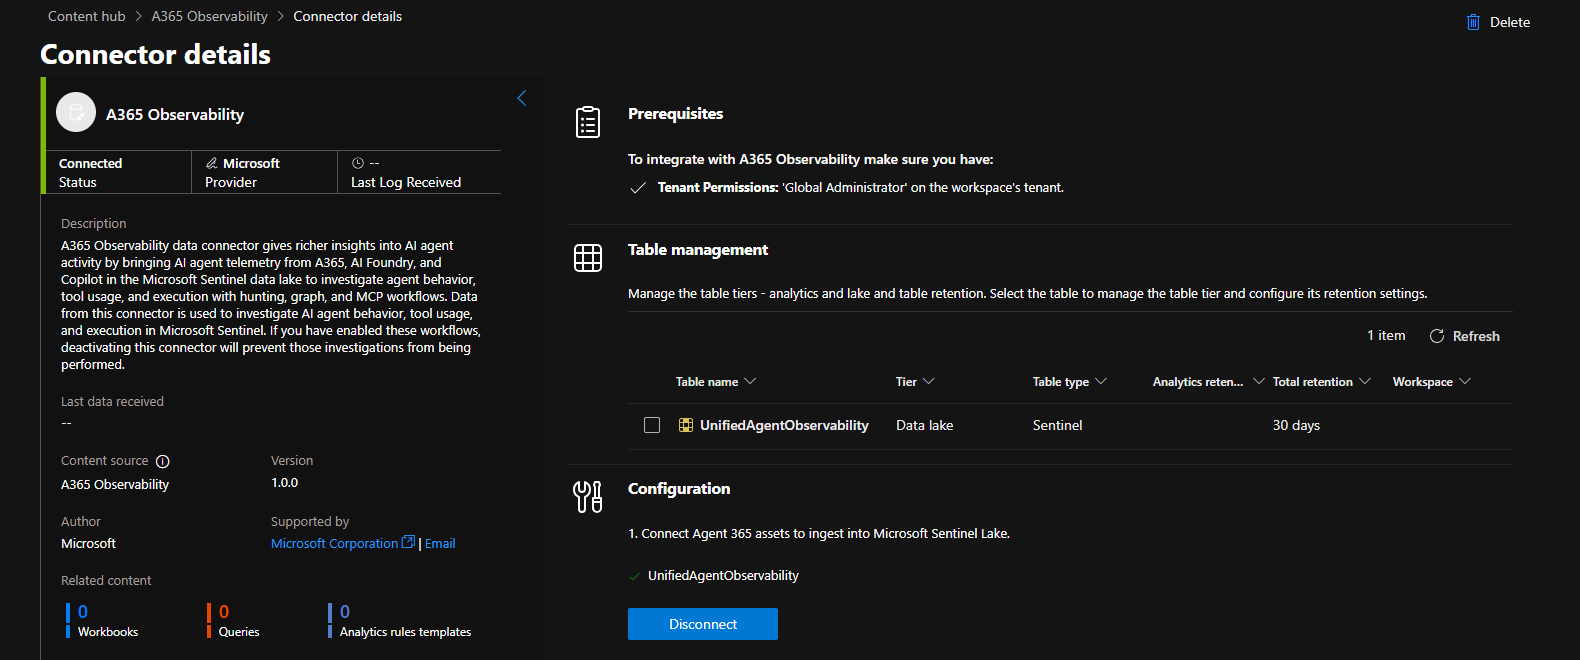
The table management section updates to show one item.
The UnifiedAgentObservability table
Once connected, the data connector creates one table in your Sentinel workspace:
| Property | Value |
|---|---|
| Table name |
UnifiedAgentObservability
|
| Tier | Data lake |
| Table type | Sentinel |
| Analytics retention | — |
| Total retention | 30 days |
The table lands in the Data lake tier, which means it's part of the Sentinel data lake rather than the Log Analytics hot tier. That's relevant for cost — data lake storage is cheaper, but some query paths behave differently depending on which tier your data is in. You can adjust the retention and tier settings from the Table management section on the connector page if 30 days isn't right for your environment.
No workbooks, no pre-built analytics rules, and no query templates ship with the current version (3.0.0) — the Related content section on the connector page shows zero for all three. You're working with raw KQL against the table for now.
What you can do with the data
Once agent telemetry is flowing, a few SOC workflows open up that didn't exist before:
Proactive hunting with KQL
The UnifiedAgentObservability table captures agent execution: prompts, tools
called, data accessed, identities involved. You can write KQL queries against it the
same way you'd hunt on SecurityEvent or SignInLogs. If an
agent has been calling tools outside its normal pattern, or accessing data it shouldn't
be near, that shows up here.
A basic starting query to see what's flowing in:
UnifiedAgentObservability
| take 100
| project TimeGenerated, AgentName, ActionType, ToolName, ResourceAccessed
Understanding blast radius with Sentinel graph
When an agent triggers an alert, the question is usually: what else did it touch? The Sentinel graph lets you pivot from the agent entity to related identities, resources, and endpoints. If an agent ran a workflow that accessed a storage account and then called an external API, you can map that chain visually rather than piecing it together from raw log lines.
Detecting access drift
Agents accumulate permissions quietly. An agent provisioned for one purpose ends up with access to three other systems because someone needed it temporarily and nobody removed the permissions. Agent telemetry gives you a behavioral baseline — what this agent normally accesses — so deviations show up. That's harder to fake your way around than a static permissions audit.
Prompt injection detection
The connector captures prompts and reasoning flows, not just tool calls. That means you can write detections against prompt content — looking for patterns that suggest an attacker is trying to override agent behavior through crafted inputs. This is an emerging detection surface, and having the raw data available is the first step.
Querying through MCP
If your SOC runs MCP-connected workflows, agent observability data is accessible through
those same pipelines. You can surface UnifiedAgentObservability records
alongside other Sentinel data in AI-assisted investigation workflows without switching
contexts.
A note on cost
The solution itself is free, but data ingestion and analytics use existing Sentinel billing meters. The data lake tier is cheaper than the analytics tier for storage, but you'll want to keep an eye on ingestion volume as agent usage in your tenant scales up. Microsoft doesn't publish a per-event size estimate at this stage, so monitor the first few weeks of ingestion carefully and set a budget alert if agent volume is expected to be high.
Putting it together
The steps are straightforward:
- In the Defender portal, go to Microsoft Sentinel → Content hub
- Search for agent 365 — select the A365 Observability result
- Click Install Solution (free, installs in seconds)
- Open the connector page and click Connect under UnifiedAgentObservability
- Wait for the "Connector Connected successfully" confirmation
- Query
UnifiedAgentObservabilityin the Sentinel data lake to confirm data is flowing
Once it's connected, the table management section shows 30-day retention by default. Adjust that to match your compliance requirements, then start writing KQL.
This is early-stage tooling — no pre-built detections, no workbooks, no built-in analytics rules yet. But having the raw telemetry in Sentinel is the foundation everything else sits on. The organizations that get ahead of AI agent security will be the ones that started capturing this data before they needed it.
Further reading
- A365 Observability data connector reference — Microsoft Learn
- Deploy Sentinel content from Content hub — Microsoft Learn
- Connect data sources to Sentinel using data connectors — Microsoft Learn
- Sample KQL queries for Sentinel data lake — Microsoft Learn
- Agent 365 connector: Monitor, hunt, and investigate AI agent activity in Microsoft Sentinel — Microsoft TechCommunity